Leave a Message

By providing your contact information to Malloy Home Team, your personal information will be processed in accordance with Malloy Home Team's Privacy Policy. By checking the box(es) below, you expressly consent to receive marketing or promotional real estate communication from Malloy Home Team in the manner selected by you. For SMS text messages, message frequency varies. Message and data rates may apply. Consent is not a condition of purchase of any goods or services. You may opt out of receiving further communications from Malloy Home Team at any time. To opt out of receiving SMS text messages, reply STOP to unsubscribe. SMS text messaging is subject to our Terms of Use.

Thank you for your message. We will be in touch with you shortly.

4 Stats That Prove This is Not 2005 All Over Again

Recent research by the National Association of Realtors (NAR) examined certain red flags that caused the housing crisis in 2005, and then compared them to today’s real estate market. Today, we want to concentrate on four of those red flags.
 
  1. Price to Rent Ratio
  2. Price to Income Ratio
  3. Mortgage Transactions
  4. House Flipping
All four categories were outside historical norms in 2005. Home prices were way above normal ratios when compared to both rents and incomes at the time.
 
NAR explained that mortgage transactions as a percentage of all home sales were also at a higher percentage:
 
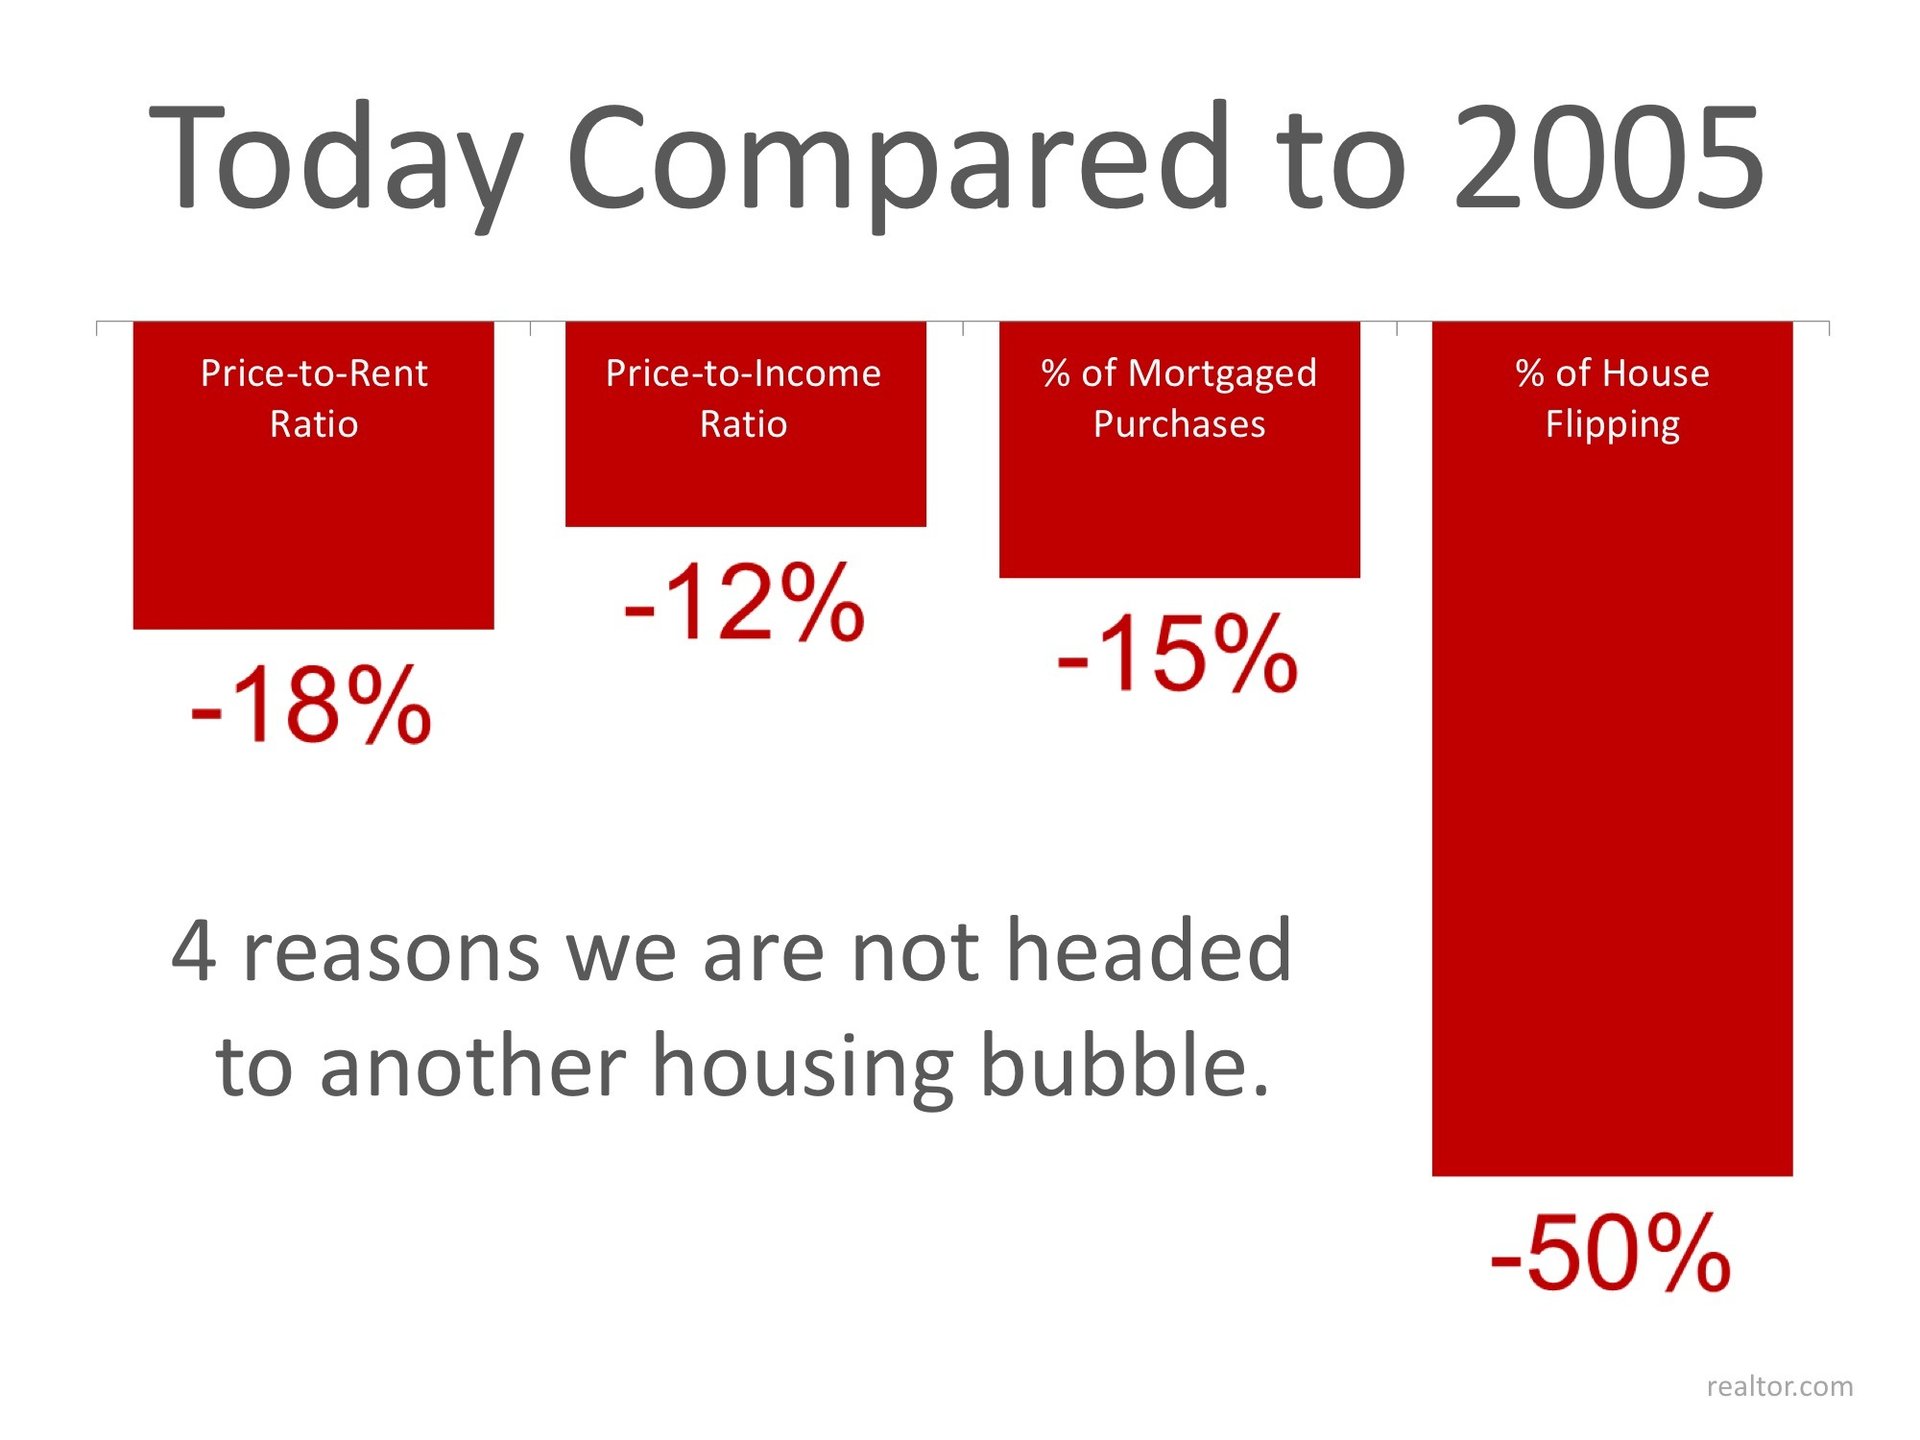
“Loose credit was one of the main culprits of the housing crisis. Mortgage lending expanded dramatically as unhealthy housing speculation reached its peak and was met by the highest level of credit availability as measured by the Mortgage Bankers Association. The index measures the overall mortgage credit condition by the share of home sales financed by mortgages. This metric does not capture credit quality, but it does set a view of the importance of financing in supporting the housing market.”
House flipping was rampant in 2005. As NAR’s research points out:
 
“Heightened flipping activity is a clear indication of speculation in the real estate market. A property is considered as a speculative flip if the property is sold twice within 12 months and with positive profit. Flipping is a normal part of a healthy housing market. In an inflated housing market, expectations about short-term profit from pure price appreciation are very high; therefore, the level of flipping activity would show evidence of being heightened.”
Here are the categories with percentages reflecting the unrealistic ratios & numbers of 2005 as compared to the current market. Remember, a negative percentage reflects a positive gain for the market.


Bottom Line

They say hindsight is 20/20. Today, experts are keeping a close watch on the potential red flags that went unnoticed in 2005.

Malloy Home Team at SERHANT.

In a market where presentation, strategy, and relationships define outcomes, choosing the right team isn’t optional, it’s everything. At the Malloy Home Team at SERHANT., we don’t just list homes. We position them. We don’t just find properties. We secure opportunities others never see.